Building an Expected Threat (xT) Model
Why xG isn't the whole picture#
xG only has something to say about shots. But a team can build an entire dangerous attack through ten passes that never produce a shot on target, and xG is silent on all of them. Expected Threat, introduced by Karun Singh in 2018 (building on an earlier idea from Sarah Rudd), values every action — not just shots — by asking: given the ball is in this exact area of the pitch, how likely is a team to eventually score?
How it actually gets computed#
The pitch is divided into a grid of zones. Each zone's value depends on two things: how often a shot from there scores, and how valuable the zones a team's passes and carries from there typically end up in. That second part is circular — a zone's value depends on its neighbours', which depend on their neighbours' — so there's no way to solve it in one pass. The fix is an iterative one: start every zone at zero, then repeatedly recompute every zone's value using the previous round's numbers, letting value propagate backward from the goal across the whole grid. After roughly 150 rounds the numbers stop changing in any way that matters. It's the same basic mechanism as the original PageRank algorithm — a page's importance depends on the importance of the pages linking to it, solved the same iterative way.
A finding worth actually building on#
The first version of this model only counted shots and completed passes when computing each zone's statistics — which implicitly assumes possession is never lost. Testing that assumption directly, rather than trusting it, showed it was a real problem: the naive model overvalued deep buildup zones by roughly 80–90% relative to zones near goal, purely because it never accounted for how often possession actually breaks down in deeper areas of the pitch. Modelling turnovers explicitly — even with the simplest possible assumption, that losing the ball has zero further value from that point — corrected this substantially.
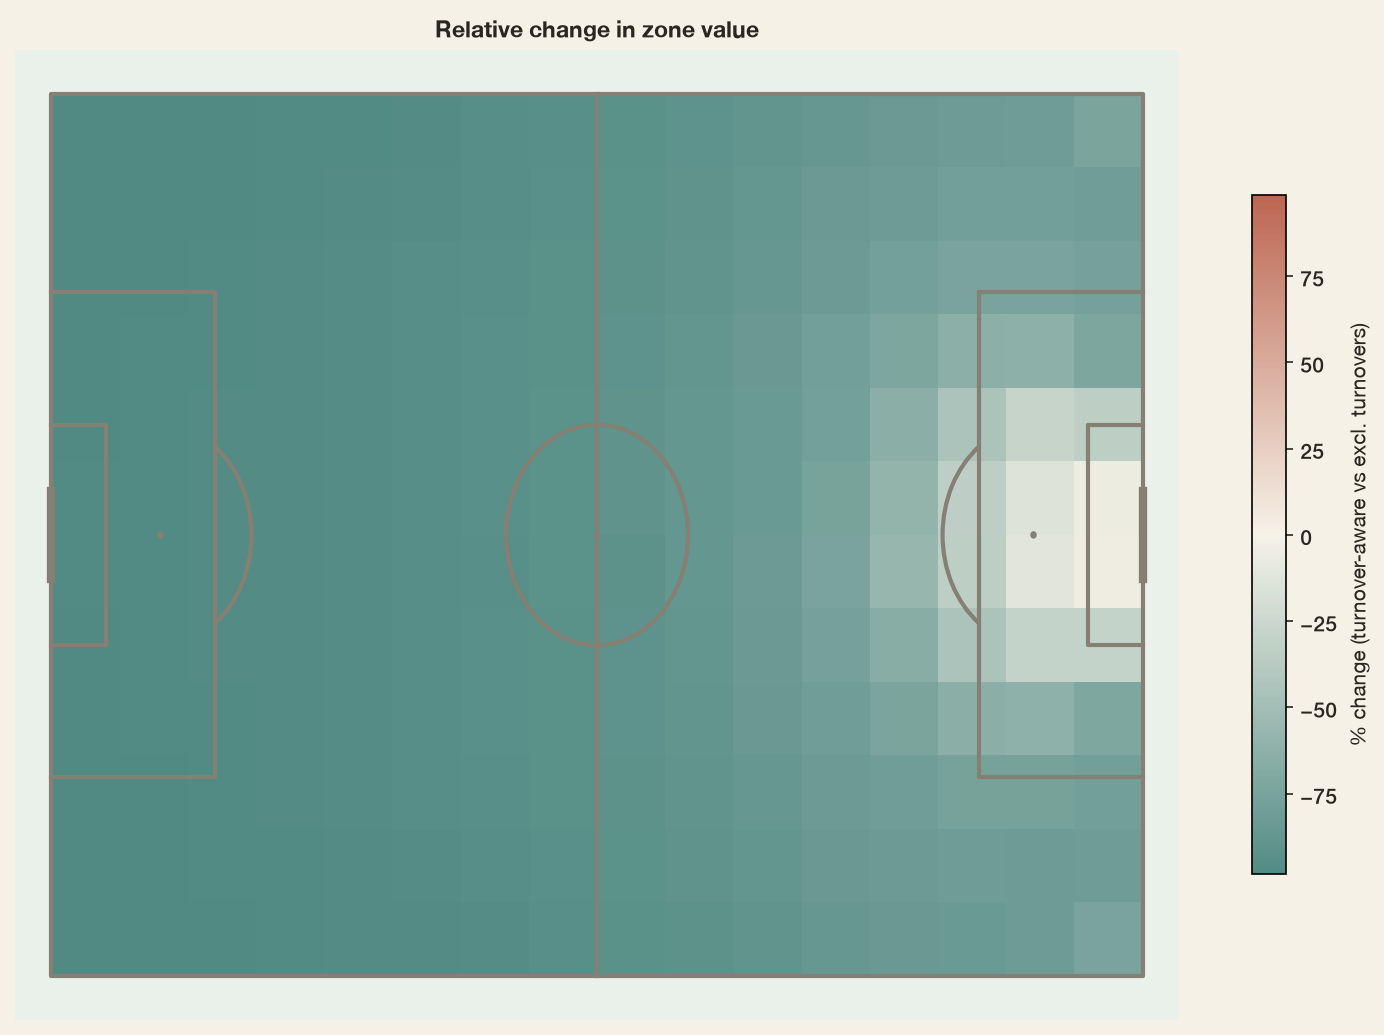
Turnover-awareness corrects deep buildup zones downward by 75–90%; the effect fades to near zero close to goal, where the naive assumption was closer to true anyway. #
A separate debugging thread, later on, dug into why the zone just outside the box (the area football analysts often call "zone 14") was showing up with a surprisingly low value — lower than parts of the team's own defensive third. The answer turned out to be genuine: the median pass or carry distance from that specific zone was almost exactly equal to the width of one grid cell, meaning a large share of actions from there were short combination play or backward safety passes that mechanically don't register as "progress" between cells. Not a bug — a real, if slightly counterintuitive, property of how congested, heavily defended areas actually get played.
Wiring it into a real backend#
Everything up to this point lived in notebooks. The last structural piece was a FastAPI service that loads the trained xG model and the computed xT grid once at startup, then serves pass networks, shot maps, and xT values over typed, documented endpoints — keeping training (expensive, done offline) cleanly separated from inference (fast, happens on every request), the same pattern any real production ML system needs.