The Data
Everything here is built on StatsBomb's free open data, which — contrary to what I expected going in — actually gives you professional-grade, event-by-event data: every pass, carry, shot, and duel, with pitch coordinates, for real matches. The catch is that the free tier only covers a specific set of competitions, not general top-flight men's football.
I ended up using five domestic women's leagues:
| League | Seasons |
|---|---|
| FA Women's Super League | 2018/19, 2019/20, 2020/21, 2023/24 |
| Frauen-Bundesliga | 2023/24 |
| Liga F | 2023/24 |
| NWSL | 2018, 2023 |
| Serie A Women | 2023/24 |
The two core models (xG and Expected Threat) are trained purely on WSL — 457 matches. The experimental predictability model, later on, needed more data than WSL alone could support, so it pools all five leagues together — 1,132 matches, ~30,000 shots, and well over half a million individual on-ball actions.
Getting the data into shape#
The first real decision wasn't about modelling at all — it was about how raw StatsBomb JSON should become something the rest of the project could build on without everyone downstream needing to know StatsBomb's export quirks.
StatsBomb's raw event data nests type-specific fields inside sub-objects — a pass has
its own pass block with recipient, outcome, and so on. I built a normalization layer
that reads every event, pulls out the handful of fields almost everything needs (who,
what, where, when, outcome), and keeps the entire original row around in a raw column
as an escape hatch for anything more specific.
The deliberate rule I followed: don't widen the canonical schema until a second
consumer genuinely needs a field. The first version didn't carry a pass's recipient,
because nothing needed it yet — until I went to build pass networks, which obviously
need to know who received the ball, and at that point promoting recipient to a real
column was the right call, rather than reaching into raw every time.
Every match gets cached locally as Parquet after its first fetch, so re-running experiments doesn't mean re-downloading from StatsBomb every time — a detail that mattered a lot once I started pulling in hundreds of matches across five leagues.
First look: what does a team's shape actually look like?#
Before any predictive modelling, the simplest useful thing to build was descriptive: a passing network. Node position is a player's average location on the ball; edge width is how often two players combined.
Applied to an Arsenal WFC match, the network showed Lia Wälti sitting centrally as the team's structural pivot — highest connectivity on the pitch — while the right side (Foord, Catley, Russo) showed noticeably denser combination play than the left, suggesting that side was where Arsenal preferred to progress the ball that game.
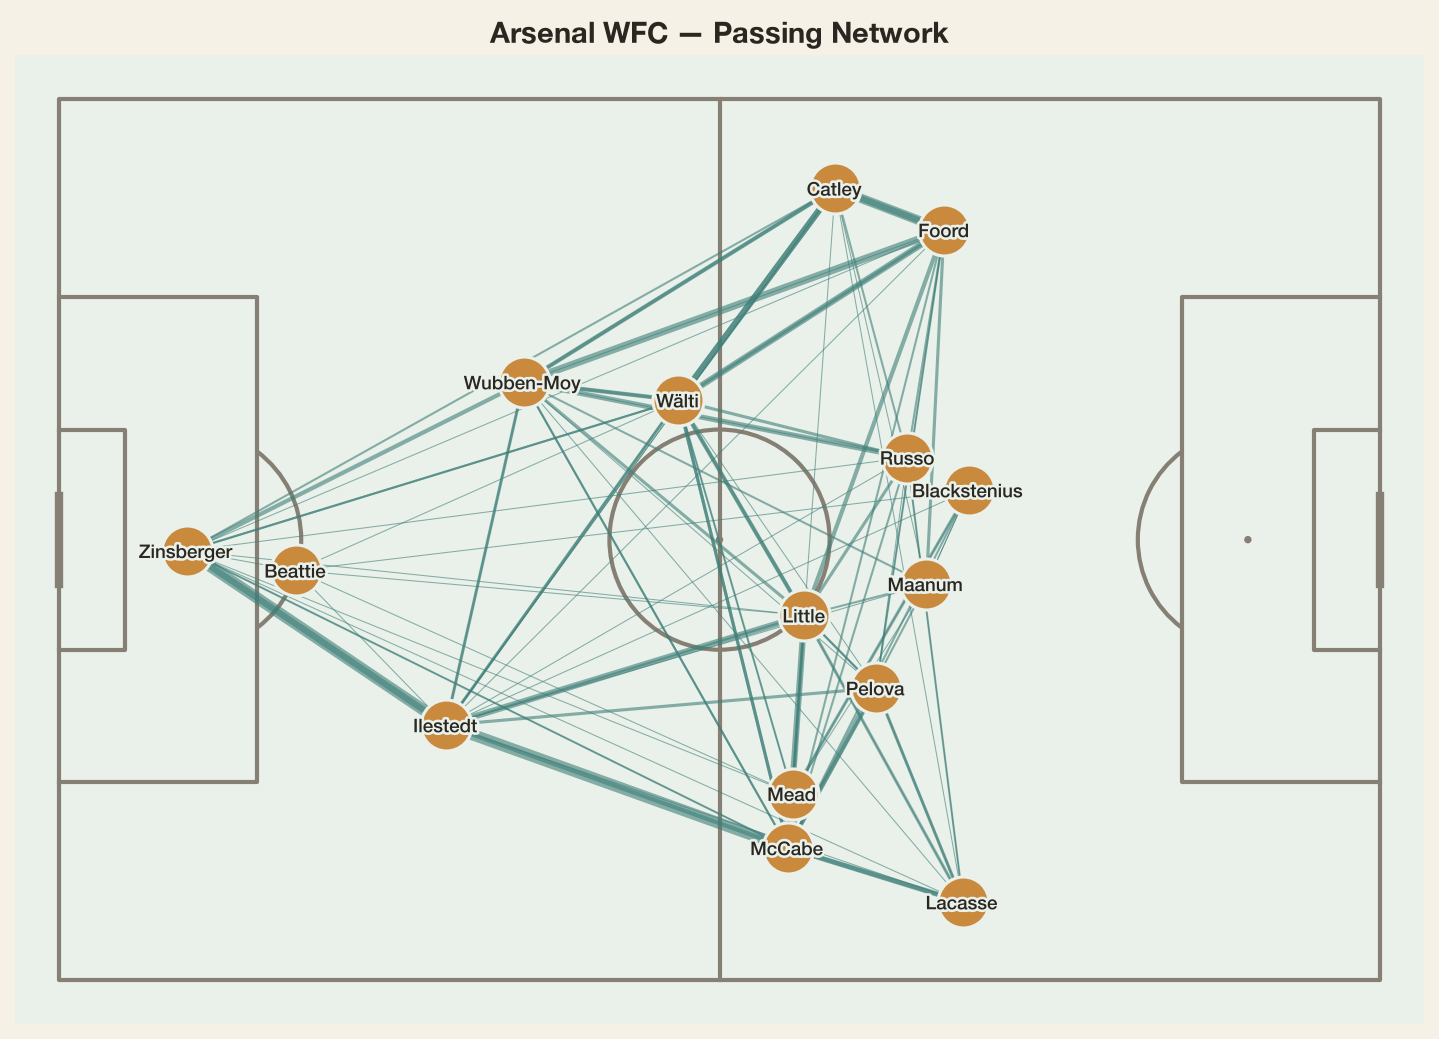
Wälti sits centrally as the clear structural pivot; the right side (Foord, Catley, Russo) shows denser combination play than the left. #
The companion piece was a shot map — marker size scaled to predicted xG, colour showing actual outcome. In the same match, Arsenal scored twice from a combined 0.74 xG — a useful early example of exactly the distinction xG exists to draw: two goals from two moderate chances is finishing quality outperforming underlying chance quality, not evidence the chances themselves were clinical.
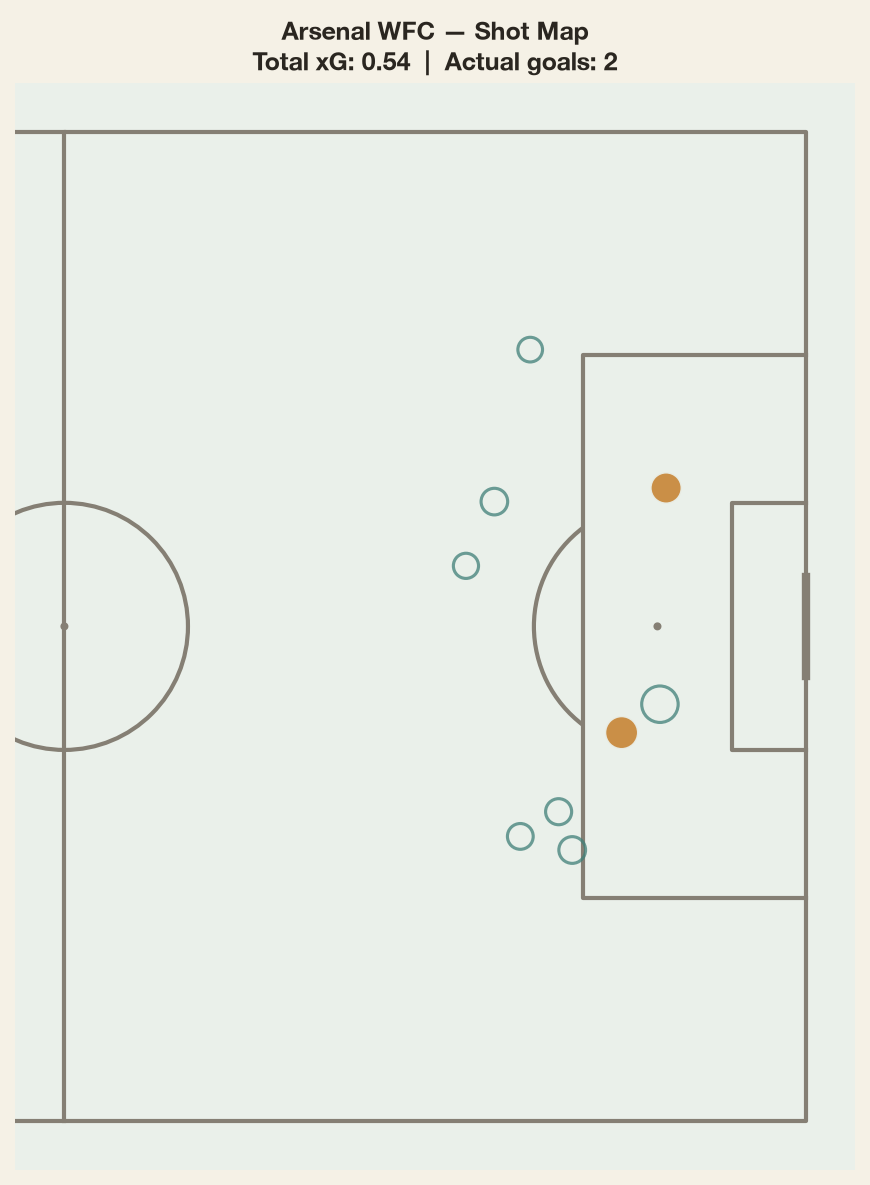
Two goals from a combined 0.54 xG in this match — finishing quality outperforming underlying chance quality. #